arviz_plots.plot_ppc_censored#
- arviz_plots.plot_ppc_censored(dt, var_names=None, filter_vars=None, group='posterior_predictive', coords=None, sample_dims=None, num_samples=100, truncation_factor=1.2, plot_collection=None, backend=None, labeller=None, aes_by_visuals=None, visuals=None, **pc_kwargs)[source]#
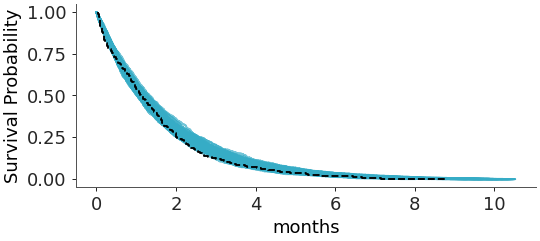
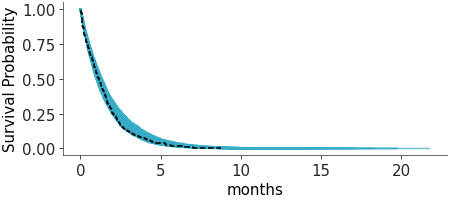
Plot Kaplan-Meier survival curve [1] vs predictive draws.
Instead of plotting the raw data observation and predictions, as is common in posterior predictive checks, this function computes the Kaplan-Meier survival curves for observed and for predictive data computes the truncated survival probabilities. The truncation is done as a factor of the maximum observed data to avoid extending the survival curves too far beyond the range of observed data.
- Parameters:
- dt
xarray.DataTree Input data containing the predictive samples and observed data. Should contain groups specified by group and “observed_data”, optionally including a censoring status variable in “constant_data”. This censoring variable should be binary where 1 indicates an event occurred and 0 indicates censoring.
- var_names
strorlistofstr, optional One or more variables to be plotted.
- filter_vars{
None, “like”, “regex”}, optional, default=None If None (default), interpret var_names as the real variables names. If “like”, interpret var_names as substrings of the real variables names. If “regex”, interpret var_names as regular expressions on the real variables names.
- group
str, default “posterior_predictive” Group to be plotted. Can be “posterior_predictive” or “prior_predictive”.
- coords
dict, optional Coordinates to subset the data.
- sample_dims
stror sequence of hashable, optional Dimensions to reduce unless mapped to an aesthetic. Defaults to
rcParams["data.sample_dims"]- num_samples
int, optional Number of samples to plot. Defaults to 100.
- truncation_factor
float, default 1.2 Factor by which to truncate the survival curves beyond the maximum observed time. Set to None to show all posterior predictive draws.
- plot_collection
PlotCollection, optional Existing plot collection to add to.
- backend{“matplotlib”, “bokeh”, “plotly”}, optional
Plotting backend to use.
- labeller
labeller, optional Labeller for plot titles and axes.
- aes_by_visualsmapping of {
strsequence ofstr}, optional Mapping of visuals to aesthetics that should use their mapping in
plot_collectionwhen plotted. Valid keys are the same as forvisuals.- visualsmapping of {
strmapping or bool}, optional Valid keys are:
observed_km -> passed to
ecdf_linepredictive -> passed to
ecdf_linexlabel -> passed to
labelled_xylabel -> passed to
labelled_ytitle -> passed to
labelled_title
- **pc_kwargs
Additional arguments passed to PlotCollection.
- dt
- Returns:
PlotCollectionThe plot collection containing the survival curve plot.
References
[1]Kaplan, E. L., & Meier, P. Nonparametric estimation from incomplete observations. JASA, 53(282). (1958) https://doi.org/10.1080/01621459.1958.10501452
Examples
Plot Kaplan-Meier curves for posterior predictive checking:
>>> from arviz_plots import plot_ppc_censored, style
>>> style.use("arviz-variat")
>>> from arviz_base import load_arviz_data
>>> dt = load_arviz_data('censored_cats')
>>> plot_ppc_censored(dt)